Clustering
k-means algorithm

K-means clustering is an unsupervised machine learning algorithm that divides a dataset into a specified number of clusters (k). The goal is to group similar data points together within a cluster and separate dissimilar data points into different clusters.
Here's a simple example of how the algorithm works:
- Choose the number of clusters (k) and randomly select k data points as the initial centroids for each cluster.
- Calculate the distance between each data point and the centroids.
- Assign each data point to the cluster with the nearest centroid.
- Recalculate the centroid for each cluster by taking the mean of all the data points in the cluster.
- Repeat steps 2-4 until the centroids no longer move or the maximum number of iterations is reached.
import numpy as np
import matplotlib.pyplot as plt
from sklearn.datasets import make_blobs
from sklearn.metrics import silhouette_score


def k_means(X, k, max_iters=100):
    # Initialize centroids randomly
    centroids = X[np.random.choice(len(X), k, replace=False)]

    for _ in range(max_iters):
        # Calculate distances between each data point and each centroid
        distances = np.sqrt(((X - centroids[:, np.newaxis]) ** 2).sum(axis=2))

        # Assign each data point to the cluster with the nearest centroid
        clusters = np.argmin(distances, axis=0)

        # Recalculate the centroid for each cluster
        centroids = np.array([X[clusters == i].mean(axis=0) for i in range(k)])

    return centroids, clusters


if __name__ == '__main__':
    # Generate some random data
    X, y = make_blobs(n_samples=1000, centers=3, n_features=2, random_state=42)

    # Plot the data
    plt.scatter(X[:, 0], X[:, 1], c=y)
    plt.show()

    found_centroids, clusters = k_means(X, k=3)

    # Plot the data and the clusters
    plt.scatter(X[:, 0], X[:, 1], c=clusters)
    plt.scatter(found_centroids[:, 0], found_centroids[:, 1], marker='x', c='black')
    plt.show()

    print(f"Silhouette score: {silhouette_score(X, clusters)}")
Measuring the quality of clustering
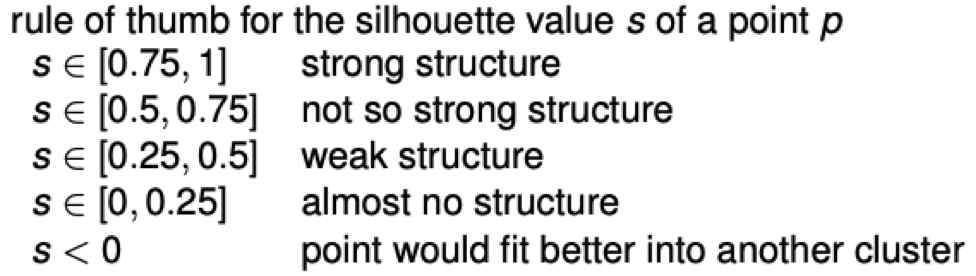
Silhouette coefficient
The silhouette coefficient is a measure of how similar an object is to its own cluster (cohesion) compared to other clusters (separation). The silhouette coefficient for a single sample is calculated as follows: \[s_i = \frac{b_i - a_i}{max(a_i, b_i)}\] where \(a_i\) is the mean distance between the sample and all other points in the same cluster, and \(b_i\) is the mean distance between the sample and all other points in the nearest cluster that is not the same as the sample's cluster.
Gaussian Mixture Models
A Gaussian mixture model is a probabilistic model that assumes all the data points are generated from a mixture of a finite number of Gaussian distributions with unknown parameters. Each Gaussian distribution is associated with one of the K components of the model. In the case of multivariate data, a Gaussian mixture model can be thought of as a generalization of the k-means clustering algorithm to incorporate uncertainty in the assignments of points to clusters.
In general, the model represents the probability distribution of the data as a weighted sum of several multivariate Gaussian distributions. The weights associated with each Gaussian reflect the relative importance of that component in the mixture. Given a set of observations, the goal of the Gaussian mixture model is to determine the parameters of the individual Gaussian's and the weights that would best explain the observed data. This is typically done by maximizing the likelihood of the observed data under the model.
import matplotlib.pyplot as plt
from sklearn.datasets import make_blobs
from sklearn.mixture import BayesianGaussianMixture

if __name__ == '__main__':
    # Generate some random data
    X, y = make_blobs(n_samples=1000, centers=3, n_features=2, random_state=42)

    # Plot the data
    plt.scatter(X[:, 0], X[:, 1], c=y)
    plt.show()

    bayesian_gaussian_mixture = BayesianGaussianMixture(n_components=3, random_state=42)
    bayesian_gaussian_mixture.fit(X)
    y_pred = bayesian_gaussian_mixture.predict(X)
    # y_pred is an array of cluster labels for each data point

    # Plot the data and the clusters
    plt.scatter(X[:, 0], X[:, 1], c=y_pred)
    plt.show()